Instructional Leadership for Science Practices
  • Home
  • Instructional Leadership
    • Observation
    • Feedback
    • Teacher Learning
  • Science Practices
    • Diagram
    • Definitions
    • Continuum
    • Readings & Resources
    • FAQ
  • Example Lessons
    • Text-Based
    • Video
    • Lesson Adaptation
  • Tools
    • Supervision Tools
    • Instruction Tools
    • PD Tools
  • About
    • Project Team

Case Study: Grade 4 Conference

Download Transcript

Focal Science Practices:
  • Asking questions
  • Developing and using models
  • Planning and carrying out investigations
  • Analyzing and interpreting data
  • Using mathematical and computational thinking
  • Constructing explanations
  • Engaging in argument from evidence
  • Obtaining, evaluating and communicating information

Related NGSS Performance Expectations: 

4-ESS2-2:Analyze and interpret data from maps to describe patterns of Earth’s features.
Transcript
Part I: Lesson­

Ms. Rivers is a fourth grade teacher who is teaching a unit on the Earth’s systems and the processes that shape the Earth. Her principal, Dr. Dalton, comes to observe the last 20 minutes of a lesson. Students are using maps that show the locations of many of the Earth’s earthquakes and volcanoes. Dr. Dalton watches groups of students work together to use the maps to answer questions Ms. Rivers gave them. One group has the following conversation.

Jonah: Okay, the third question here says Where on the map do you see the most volcanoes?

Henry: I see them everywhere. Those red dots on the map are volcanoes, right? So, there are red dots everywhere.

Robyn: So, what do we put down?

Henry: Well, there are lots of red dots over here, near Japan. I’m putting down Japan.

Jonah: Last question. Where are there a lot of earthquakes? Those are the blue dots on the map. Let’s put down Japan also.

Ms. Rivers asks for everyone to put their maps down and turn their attention to her.

Ms. Rivers: Great work, scientists. I liked how you were talking to each other to answer the questions and analyze the maps. Those maps were your data. They are information that other scientists gathered by measuring and observing earthquakes and volcanoes all over the world. Let’s go over everyone’s answers to the questions.

Ms. Rivers asks students to raise their hands and share their group’s answers. Several students are called on to provide their answers.

Ms. Rivers: Let’s finish up today by talking with our groups again. Now that we have used these maps, do you have a hypothesis about where a new volcano might occur?

Dr. Dalton listens in on a different group of students this time.

Evelyn: There are volcanoes all over the place on these maps. Maybe there could be a new one in Japan. There are lots there already.

Steve: Yeah, there are lots of places with volcanoes already. Look at Mexico and Russia. Maybe there?

Evelyn: Maybe a new volcano would be somewhere there isn’t one already.

Steve: You mean like where there are mountains but no red dots? What about the Rocky Mountains?

Evelyn: Yeah, that makes sense.


Part II: Conference

Dr. Dalton and Ms. Rivers meet the following morning to discuss Dr. Dalton’s observation.

Dr. Dalton: I loved seeing the students interact with each other so well! They are really on task, talking to each other about the science. I know how challenging this is to do with kids this age.

Ms. Rivers: I’ve been working on that. I know that an important part of science is kids talking to each other.

Dr. Dalton: So, tell me a little about what science practices you were trying to address during this class.

Ms. Rivers: As I said to the students, the maps are data. So, I was having them analyze data. I also wanted them to do argumentation at the end of the lesson. I’m not so sure that part really worked.

Dr. Dalton: In the future we can work on argumentation, but let’s focus on the analyzing and interpreting data practice right now. I agree that maps can be a great source of scientific data for students to analyze. What was the role of the questions you gave them in their analysis of the maps?

Ms. Rivers: I wanted them to analyze the maps to figure out that earthquakes and volcanoes occur in specific patterns. I was next going to connect these patterns to plate boundaries. I wrote the questions to scaffold them in finding these patterns.

Dr. Dalton: And so did they figure this out?

Ms. Rivers: I guess I don’t know. The answers to the questions were a little simplistic. Most of the students just named places where there were volcanoes and earthquakes.

Dr. Dalton: I agree. I think you had the right idea to scaffold such a complex task as analyzing a map, but the questions didn’t seem to push the students to figure out the patterns or relationships in the maps that you just mentioned.

Ms. Rivers: I am always struggling with scaffolds. I know they can help my students do things like this, but I can never figure out how to use the scaffold to actually get the students to do the complicated things. I mean, I am not sure how to get them to analyze the map and actually figure out that the volcanoes and earthquakes happen mostly at the plate boundaries.

Dr. Dalton: I think that is something we could really work on. I am glad you brought it up. What would you think about working with Ms. Young on some scaffolds to help your students more effectively analyze data? She and I worked on that last year together.

Ms. Rivers: That would be very helpful.

Dr. Dalton: Why don’t I send an e-mail to both of you and then the two of you can figure out a time to meet. Let me know if you just want to meet on your own or if it would be helpful for me to come too.

Ms. Rivers: Sounds great.

Dr. Dalton: I’ll come observe after you have had a chance to work a little with Ms. Young. In two weeks, can you let me know about another lesson where students will be analyzing data?

Ms. Rivers: Absolutely. Thank you.


Part III: The Next Lesson 

Three weeks later, Ms. Rivers is once again doing a lesson that involves students analyzing and interpreting data. Dr. Dalton observes the start of the lesson.

Ms. Rivers: Okay scientists, today we have some new data to look at. This table shows 5 major earthquakes – A, B, C, D, and E. The second column of the data table shows how much destruction happened from the earthquake. It uses a scale of 0 to 12.  0 means no destruction and 12 means total destruction. The third column shows how hard the ground is at each place.  So, let’s look at Earthquake A. Can someone tell me how much destruction happened?

Ellen: It says 8. That’s a pretty high number so I think that a lot of destruction happened.

Joe: You mean like buildings fell down and people got hurt?

Ms. Rivers: Exactly. Okay, how hard was the ground there?

Jessica: It was soft.

Ms. Rivers: Good. So today you will be figuring out how the amount of destruction relates to how hard the ground is. The sheet I just passed out to all of you has some steps to follow to help you figure this out.
CLICK HERE 
for blank copies of 
these tools 
Tools
Initial Observation Form
Picture
Conference Worksheet
Picture
Follow-Up Observation Form
Picture
Picture
Ms. Rivers answers a few student questions and then puts students into group to begin the assignment. Similar to her first lesson, she provides the students with a scaffold to support their analysis of the data. However, this time her scaffold is a series of steps to follow geared toward enabling students to discover the pattern in the data. Dr. Dalton observes the students starting to work and then listens in on one student group. 

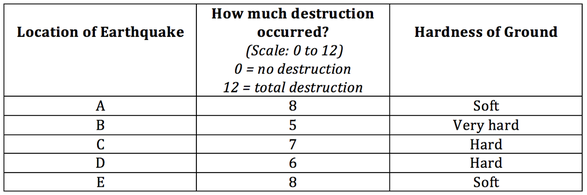
Brett: Okay, here’s the next step: Put the earthquakes in order from most destruction to least. 

Rachel: Okay, so first A and E, then C, then D, then B. 

Josh: Now it says we should write the ground hardness next to each earthquake. So A and E are both soft. And C and D are both hard. And B is very hard.

Brett: Now we are supposed to answer the question What happens to the amount of destruction as the ground hardness goes from “soft” to “very hard”?

Josh: It looks like the earthquake with the biggest destruction number has the softest ground. 

Brett: You mean, earthquake A? Oh, I see. It is an 8 for destruction. 

Rachel: And earthquake C has a 7 and hard ground. So that’s a smaller destruction number and the ground is harder. 

Brett: That pattern keeps going. The earthquakes with the very hard ground have the smallest destruction numbers.

Josh: So the answer to the question is that as the hardness goes from “soft” to “very hard,” the destruction goes down. 

When the students have finished, Ms. Rivers calls the class back together. 

Ms. Rivers: Okay, so what did we figure out about how the hardness of the ground is related to how much destruction happens? 

Jessica: We saw that the harder the ground, the less destruction. 

Ms. Rivers: Give me a thumbs up if you agree with Jessica and a thumbs down if you disagree. 

The students vote. Ms. Rivers calls on Diego to explain why he agrees. 

Diego: I agree because we saw that the bigger the destruction numbers, like the earthquake with an 8, the ground was soft. But the lower the destruction numbers, like the earthquake that was a 5, the ground was very hard. 

Ms. Rivers: Who would like to explain why they think harder ground means less destruction? Mandy?

Mandy: I think that if a building is on soft ground and there is an earthquake then the ground isn’t really holding the building tight and the building can move around a lot and fall apart really easily. It might even hurt someone if it falls apart. But if there is hard ground, the building doesn’t move around as much so it probably doesn’t fall apart and hurt people as much. 

The students continue to discuss the relationships in the data and the reasons why the amount of destruction is related to the ground hardness. Dr. Dalton leaves to go observe another class. 
PLACEHOLDER

Funded by the National Science Foundation
Proudly powered by Weebly
  • Home
  • Instructional Leadership
    • Observation
    • Feedback
    • Teacher Learning
  • Science Practices
    • Diagram
    • Definitions
    • Continuum
    • Readings & Resources
    • FAQ
  • Example Lessons
    • Text-Based
    • Video
    • Lesson Adaptation
  • Tools
    • Supervision Tools
    • Instruction Tools
    • PD Tools
  • About
    • Project Team