Instructional Leadership for Science Practices
  • Home
  • Instructional Leadership
    • Observation
    • Feedback
    • Teacher Learning
  • Science Practices
    • Diagram
    • Definitions
    • Continuum
    • Readings & Resources
    • FAQ
  • Example Lessons
    • Text-Based
    • Video
    • Lesson Adaptation
  • Tools
    • Supervision Tools
    • Instruction Tools
    • PD Tools
  • About
    • Project Team

Case Study: Grade 6 Conference

Download Transcript

Focal Science Practices:
  • Asking questions
  • Developing and using models
  • Planning and carrying out investigations
  • Analyzing and interpreting data
  • Using mathematical and computational thinking
  • Constructing explanations
  • Engaging in argument from evidence
  • Obtaining, evaluating and communicating information

Related NGSS Performance Expectations: 

­MS-LS4-3: Construct an explanation based on evidence that describes how genetic variation of traits in a population increase some individuals’ probability of surviving and reproducing in a specific environment.

Transcript
Part I: Lesson­

Ms. Bridgewater’s 6th graders are studying adaptation and natural selection. The school’s assistant principal, Ms. Manuel, stops by to observe part of today’s lesson. Ms. Bridgewater is introducing a set of data to the students about black and green bugs. These bugs live in grassy areas and are hunted by birds. Recently, pollution from a nearby power plant has altered the color of the grass in some areas of the habitat, changing it from green to black. 

Ms. Bridgewater: Now I’m passing out the data to you that we just talked about. You are getting a graph showing what the bug population has been for the last few years and a data table showing how much pollution has been coming from the power plant. There are also pictures of this environment. One picture is from 10 years ago, one from 5 years ago, and one is from last year. Your job today is to use this data and work with your group to answer the question: Will the pollution affect the bugs?

Ms. Manuel walks around and listens in on one group of students.

 Leslie: The graph here shows that for the past few years there have been way more black bugs than green bugs.

Juan: Wow. Look these pictures! The grass was green 10 years ago but now it has some spots that are turning black. Cool.

Leslie: I’ve never seen black grass before. I wonder why it turned black.

Sadie: Is that because of the pollution? So the answer is that the pollution will affect the bugs?

Juan: Sounds good to me.

Ms. Bridgewater listens to another group.

Joshua: The question is Will the pollution affect the bugs?

Daniel: Probably, right? I mean, pollution affects everything.

Isabel: I think we should look at the graph.

Joshua: The graph shows that there have always been way more green bugs than black bugs. What does that have to do with pollution?

Isabel: I wonder if the pollution will make there be more black bugs than green bugs.

Daniel: Maybe the pollution will make red bugs appear!

As Ms. Manuel leaves to observe another class, Ms. Bridgewater calls the students back together to discuss their work.  

Part II: Conference

Ms. Bridgewater and Ms. Manuel meet later that afternoon to discuss the lesson Ms. Manuel observed.

Ms. Manuel: Tell me a little about how you think the lesson went.

Ms. Bridgewater: It was pretty good. I mean, the kids were using all that data.

Ms. Manuel: I was impressed that you were able to find data in three different formats for your students to use. I know that we have been working on moving beyond just data tables to display data.

Ms. Bridgewater: Yeah, I was especially interested to see how they would use those pictures of the environment. I hoped they would see that the grass was starting to turn black and relate that to the data showing an increase in pollution.

Ms. Manuel: So, clearly analyzing data was one science practice you were focusing on today. Anything else?

 Ms. Bridgewater: Actually, I was also trying to get the students to write scientific explanations. I wanted them to use all that data to create a claim that answers the question.

Ms. Manuel: Then let’s focus on that practice. Did you think the students were able to create scientific explanations?

Ms. Bridgewater: They answered the question I gave them, I mean, most groups said yes, the pollution affects the bugs, but they didn’t really seem like explanations. I know that scientific explanations should be about how or why a phenomenon happens. I wanted the students to use the data and explain how they think the pollution might cause the populations of the green and black bugs to change.

Ms. Manuel: I agree. I listened in on two different groups, and like you said, they answered the question but didn’t go much beyond that. How do you think you could get students to address the “how” aspect?

Ms. Bridgewater: I wonder if an important first step is just making sure the students know what it means to write a scientific explanation. I just assumed that they would support their claims, but I think I should be much clearer with them about what makes their answer a scientific explanation.

Ms. Manuel: I agree. Clear expectations are really important. Also, I wonder about the question you asked. “Will the pollution affect the bugs?” That sounds like it is asking for a yes or no answer instead of an explanation about how the pollution might affect the bugs.

Ms. Bridgewater: Good point. So it sounds like I should focus on two things. First, I could introduce the idea of a scientific explanation and maybe make a poster to hang in the room that says that the goal of a scientific explanation is to explain how or why something occurs. Then I will make sure that the questions I ask really align with writing an explanation.

Ms. Manuel: I like that plan. I am planning to be back in your room in three weeks. Can you let me know when a good time is to stop in and see you teach again about explanations?

Ms. Bridgewater: Absolutely. I’ll e-mail you.  

Part III: The Next Lesson

 Three weeks later, Ms. Manuel stops in to observe another lesson. This time students are using data about birds with different types of beaks. Ms. Bridgewater has written on the board:

 Write a scientific explanation:

Which species of birds will have the most offspring?

 Ms. Bridgewater: Before we start answering this question, let’s remind ourselves what makes our answers to this question a scientific explanation. Kendra?

Kendra: A scientific explanation should tell why something happens. So, why the type of bird will have the most offspring. Those are babies, right?

Ms. Bridgewater: Exactly. Your job is to use the two data tables about how much the different types of birds eat and the kinds of flowers and seeds in this environment, and of course what you know about adaptation and survival, to explain why the bird type you chose will have the most offspring. And where can you look if you forget what makes something a scientific explanation?

Gustavo: That poster on the wall.
CLICK HERE 
for blank copies of 
these tools 
Tools
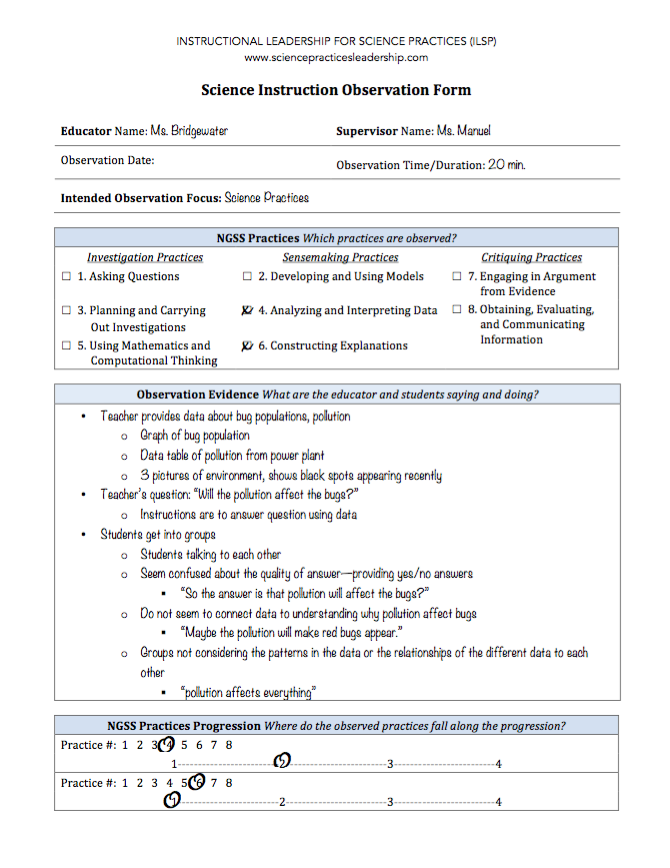
Initial Observation Form
Picture
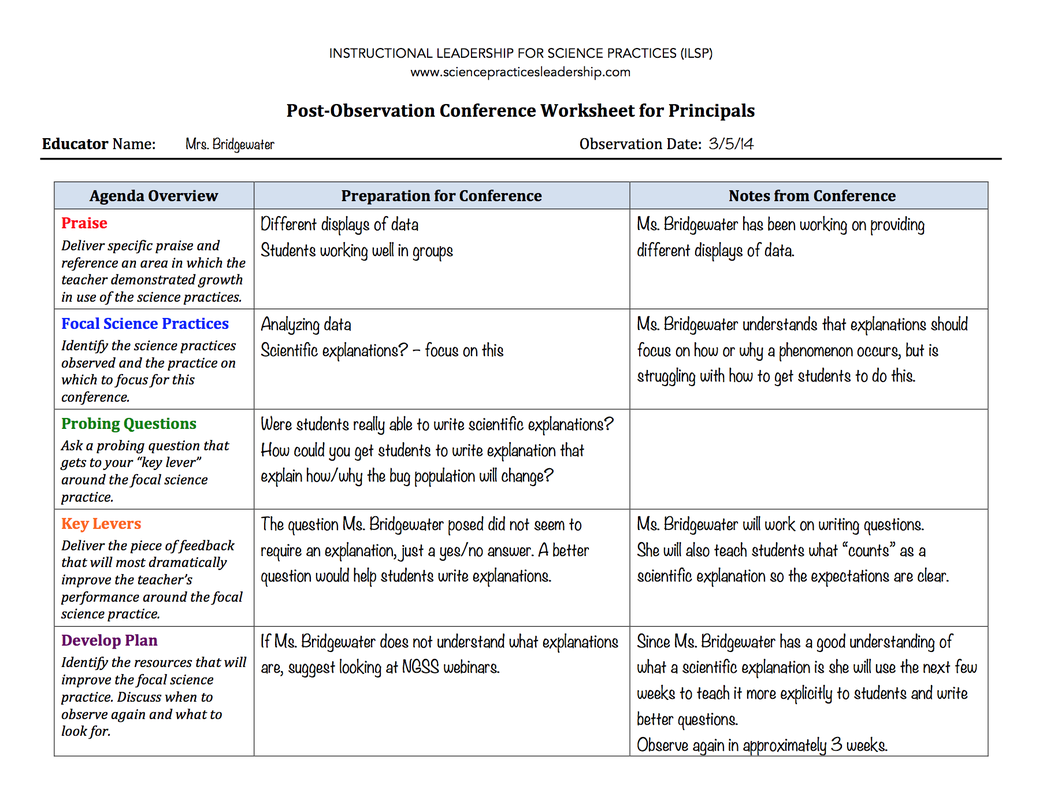
Conference Worksheet
Picture
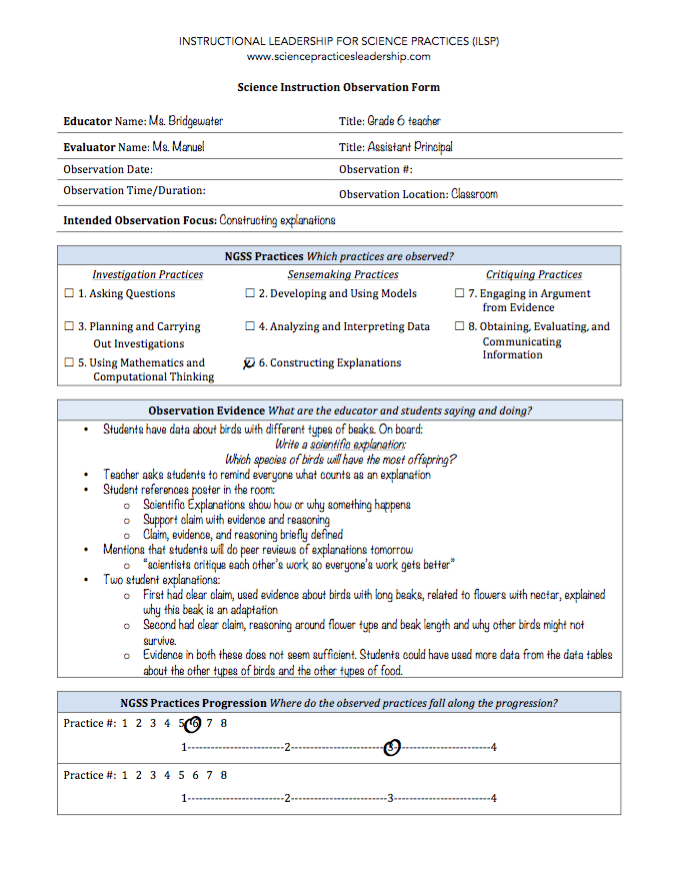
Follow-Up Observation Form
Picture
Picture
Ms. Bridgewater: Good. Today you are each going to write your own explanation and tomorrow we will have a chance to share them with each other and give each other feedback.

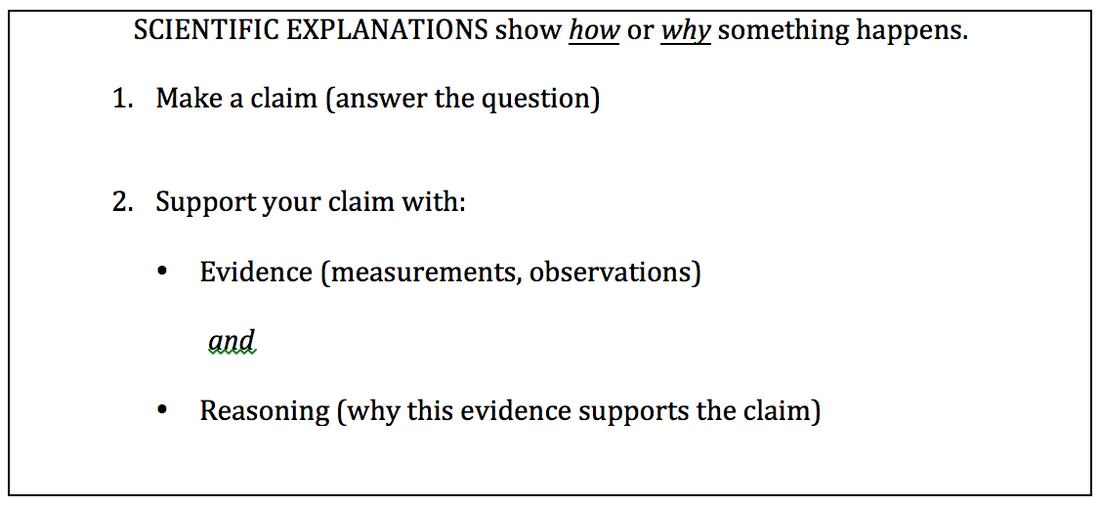
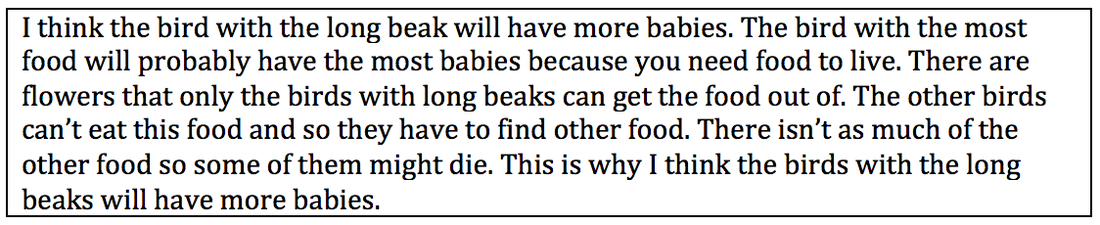
Kendra: Can we change them after that?

Ms. Bridgewater: Of course. That is what scientists do. They critique each other’s work so everyone’s work gets better. But today, focus on making sure your explanation uses data to explain why you think one species of bird will have the most offspring.

The students write. Ms. Manuel asks to read Jill’s explanation when she is done. 
Picture
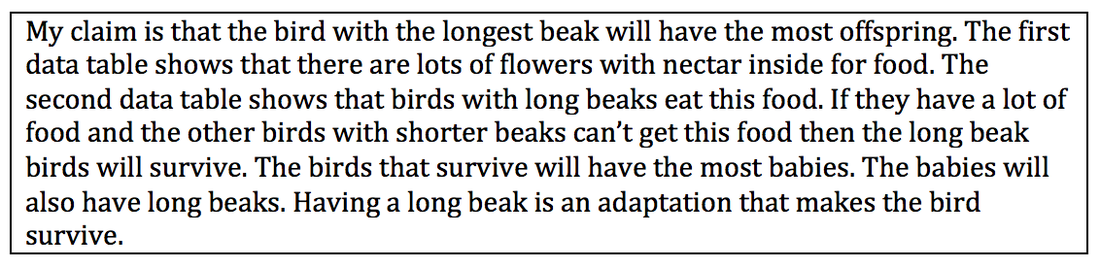
She then asks to read Luke’s explanation. 
Picture
PLACEHOLDER

Funded by the National Science Foundation
Proudly powered by Weebly
  • Home
  • Instructional Leadership
    • Observation
    • Feedback
    • Teacher Learning
  • Science Practices
    • Diagram
    • Definitions
    • Continuum
    • Readings & Resources
    • FAQ
  • Example Lessons
    • Text-Based
    • Video
    • Lesson Adaptation
  • Tools
    • Supervision Tools
    • Instruction Tools
    • PD Tools
  • About
    • Project Team